How to Monitor JRun Application Server Using eG Enterprise?
eG Enterprise monitors the JRun application servers in both agentless and agent-based manners. Before attempting JRun monitoring, a set of pre-requisites should be fulfilled to configure the JRun application server to work with eG agent. The following sections describe how to configure a JRun application server to work with eG agent.
Configuring a JRun application server 3.0
In order to configure a JRun application server for monitoring by an eG agent, you need to enable the monitoring logs and configure the global.properties for customizing the output of the monitoring logs, by following the steps given below:
- Open the global.properties file that resides in the <JRUN_INSTALL_DIR>/lib directory.
-
Look for the entry logging.loglevel and alter its value to:
logging.loglevel=info,warning,error,metrics
This ensures that all information, warnings, errors and metrics are logged by the JRun server. The eG agent uses the logged metrics for collecting statistics related to a JRun server.
-
The eG agent requires the metrics reported by each JRun server instance to be logged to a separate file. To do so, set the logging.filelogwriter.filename property as shown below:
logging.filelogwriter.filename={jrun.rootdir}/logs/{jrun.server.name}-{log.level}.log
The above process creates a log file named <SERVER_NAME>-metrics.log, to which the measures generated during monitoring are logged. The eG agent reads the data available in this log file and displays the same in the monitor interface.
-
Next, set the value of the properties logging.filelogwriter.rotationsize and logging.filelogwriter.rotationfiles in the global.properties file to 100000 and 5 respectively, as shown below:
logging.filelogwriter.rotationsize=100000
logging.filelogwriter.rotationfiles=5The rotation size specifies the maximum size of a log file. The smaller the value, the lower the monitoring overhead.
-
Ensure that the monitor.format property is set to {monitor.combined-format}. Then, reconfigure the value of monitor.combined-format as shown below, to define the pattern in which the metrics are to be logged.
monitor.combined-format=(jcp+web) {{jcp.busyTh}+{web.busyTh}} {{jcp.delayTh}+{web.delayTh}} {{jcp.totalTh}+{web.totalTh}} {totalMemory} {freeMemory} {sessions} {sessionsInMem} {{jcp.handledRq}+{web.handledRq}} {{jcp.handledMs}+{web.handledMs}} {{jcp.bytesIn}+{web.bytesIn}} {{jcp.bytesOut}+{web.bytesOut}} {{jcp.delayMs}+{web.delayMs}} {{jcp.delayRq}+{web.delayRq}} {{jcp.droppedRq}+{web.droppedRq}}
-
Then, set monitor.interval to a value (in seconds), which could be 80-90% of the test frequency. This value has to be very carefully set as all the measures that the agent reports would be relative to the frequency at which the logging is taking place.
For example, if the eG agent executes all the related JRun tests at a frequency of 300 seconds, set the value of monitor.interval to 270 (300*0.09) as shown below:
monitor.interval=270
-
Finally, restart the JRun default server service and check whether the metrics that have logged into the default-metrics.log file are in the following format:
05/29 19:05:39 metrics (JRun) (jcp+web) 0 0 11 1984 747 0 0 25 340 6950 6852 0 0
05/29 19:05:49 metrics (JRun) (jcp+web) 0 0 11 1984 606 0 0 14 171 3892 3836 0 0 0
05/29 19:05:59 metrics (JRun) (jcp+web) 0 0 11 1984 523 0 0 0 0 0 0 0 0 0
05/29 19:06:09 metrics (JRun) (jcp+web) 0 0 11 1984 440 0 0 0 0 0 0 0 0 0
05/29 19:06:19 metrics (JRun) (jcp+web) 0 0 11 1984 358 0 0 0 0 0 0 0 0 0
Configuring a JRun Application Server 4.0
A single JRun server 4.0 may contain multiple server instances. The JRun application server 4.0 maintains individual logs for each of its server instances.
To monitor a specific server, modify the file jrun.xml which lies in the <JRUN_INSTALL_DIR>/servers/<SERVER_NAME>/SERVER-INF directory, where JRUN_INSTALL_DIR is the home directory for the JRun server and SERVER_NAME is the name of the server instance. For example, if you have a server instance named APPLICATION 1, then the SERVER_NAME will be APPLICATION 1.
Make the following changes in this file:
-
Enable metrics logging by setting the metricsEnabled attribute of LoggerService to true as shown below.
<attribute name="metricsEnabled">true</attribute>
-
Next, specify the file name to which the metrics must be logged. For that, add {log.level} to the filename attribute of the FileLogEventHandler service, as shown by the following example:
<service class="jrunx.logger.FileLogEventHandler" name="FileLogEventHandler">
<attribute name="filename">{jrun.rootdir}/logs/{jrun.server.name}-{log.level}.log</attribute>
</service>The above process creates a log file named <SERVER_NAME>-metrics.log, to which the measures generated during monitoring are logged. The eG agent reads the data available in this log file and displays the same in the monitor interface.
-
Set the rotationSize and rotationFiles attribute of the FileLogEventHandler service to 100k and 3 respectively as shown below:
<attribute name="rotationSize">100k</attribute>
<attribute name="rotationFiles">3</attribute>The rotation size specifies the maximum size of a log file. The smaller the value, the lower the monitoring overhead.
-
To define the format in which metrics are to be logged, make the following changes in the metricsFormat attribute of the LoggerService.
<attribute name="metricsFormat">{{jrpp.busyTh}+{web.busyTh}} {{jrpp.delayTh}+{web.delayTh}} {{jrpp.totalTh}+{web.totalTh}} {totalMemory} {freeMemory} {sessions} {sessionsInMem} {{jrpp.handledRq}+{web.handledRq}} {{jrpp.handledMs}+{web.handledMs}} {{jrpp.bytesIn}+{web.bytesIn}} {{jrpp.bytesOut}+{web.bytesOut}} {{jrpp.delayMs}+{web.delayMs}} {{jrpp.delayRq}+{web.delayRq}} {{jrpp.droppedRq}+{web.droppedRq}}</attribute>
-
Then, set the metricsLogFrequency attribute of LoggerService to a value (in seconds), which could be 80-90% of the test frequency. This value has to be very carefully set as all the measures that the agent reports would be relative to the frequency at which the logging is taking place.
For example, if the eG agent executes all the related JRun tests at a frequency of 300 seconds, set the value of metricsLogFrequency to 270 (300*0.09) as shown below:
<attribute name="metricsLogFrequency">270</attribute>
-
Finally, restart the specific JRun server for which you have enabled metrics logging and check whether the metrics that have logged into the <SERVER_NAME>-metrics.log file are in the following format:
06/14 12:06:58 metrics 0 0 1 32576 29198 1 1 0 0 0 0 0 0 0
06/14 12:11:28 metrics 0 0 2 32576 28310 1 1 18 17646 4535 2845 0 0 0
06/14 12:15:58 metrics 0 0 2 32576 29918 1 1 1 151 308 254 0 0 0
06/14 12:20:28 metrics 0 0 1 32576 29892 1 1 0 0 0 0 0 0 0
Configuring the eG Agent to Collect JVM-related Metrics from the JRun Server 3.0
The jvm layer of the JRun monitoring model is mapped to tests that report critical statistics related to the JRun server’s JVM. These statistics typically reveal the following:
- The count of classes loaded/unloaded (Java Classes test)
- JVM thread usage (JVM Threads test)
- CPU and memory usage of the JVM (JVM Cpu Usage test and JVM Memory Usage test)
- The effectiveness of the JVM’s garbage collection activity (JVM Garbage Collections test)
- The uptime of the JVM (JVM Uptime test)
- Whether JMX is currently enabled/disabled on the target WebLogic server (JMX Connection to JVM test)
- The count and status of file descriptors (JVM File Descriptors test)
These tests connect to the JRE used by the JRun application server to pull out the above-mentioned metrics. For these tests to execute, you should configure the eG agent to connect to JRE and collect the required metrics, using either of the following methodologies:
- JMX (Java Management Extensions)
- SNMP (Simple Network Management Protocol)
Since both JMX and SNMP support are available for JRE 1.5 and above only, these tests will work only if the JRun server being monitored uses JRE 1.5 and above.
If you choose to use JMX for pulling out the desired metrics from the JRE, then the following broad steps need to be followed before configuring these tests:
- First, determine whether the JMX requires no authentication at all, or requires authentication (but no security)
-
If JMX does not require authentication, follow the steps below:
- Login to the target JRun server.
- Edit the management.properties file that is used by the JRE of the target JRun server, and configure the following in it:
- The JMX remote port
- Whether JMX is SSL-enabled or not
- Whether JMX requires authentication or not
- To know how to configure these, refer to the Monitoring Java Applications document.
- Save the file.
-
If the JMX requires authentication (but no security), follow the steps below:
- Login to the target JRun server. If the server is executing on a Windows host, then, login to the host as a local/domain administrator.
- Next, copy the jmxremote.password.template file in the <JAVA_HOME>\jre\lib\management folder to any other location on the host, rename it as as jmxremote.password, and then, copy it back to the <JAVA_HOME>\jre\lib\ management folder.
- Next, edit the jmxremote.password file and the jmxremote.access file to create a user with read-write access to the JMX. To know how to create such a user, refer to Monitoring Java Applications document.
- Then, proceed to make the jmxremote.password file secure by granting a single user “full access” to that file. To know how to achieve this, refer to the Monitoring Java Applications document.
-
Edit the management.properties file that is used by the JRE of the target JRun server, and configure the following in it:
- The JMX remote port
- Whether JMX is SSL-enabled or not
- Whether JMX requires authentication or not
- The full path to the jmxremote.access file
- The full path to the jmxremote.password file
To know how to configure these, refer to the Monitoring Java Applications document.
- Then, save the file.
- Next, connect to the JRun application management console using the URL: http://<JRunServerIP>:<JRunPort>
- The default port number of the JRun server is 8000.
- Provide the credentials for logging into the console, if prompted.
-
When the console opens, you will find a tree-structure in the left panel of the console. Follow the node sequence, JRun Default Server -> Java Settings, in the tree-structure.
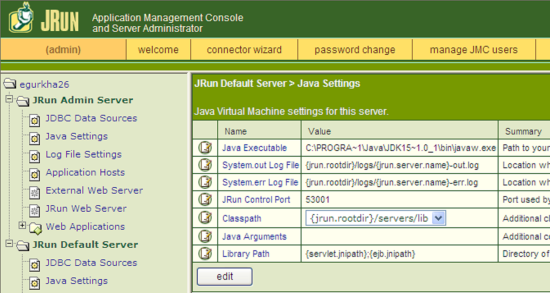
Figure 1 : Viewing the Java Virtual Machine Settings for the target JRun server
-
The Java Virtual Machine settings will then appear in the right panel (see Figure 1). Click on the icon preceding the Java Arguments entry in the right panel.
-
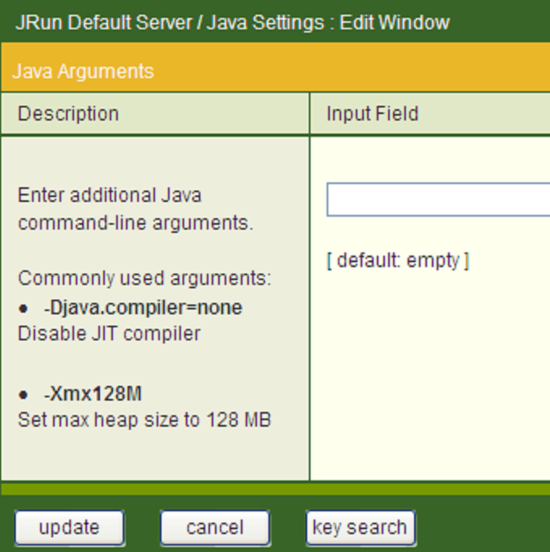
In the Input Field text box of Figure 2 that appears, enter the following:
-Dcom.sun.management.config.file=<Path to management.properties file used the JRE of the target JRun server>
- Finally, stop and start the JRun server.
Note:
To know how to enable SNMP support for the JRE, refer to the Monitoring Java Applications document.
Once the above-said pre-requisistes are fulfilled, proceed to manage the JRun application server using the eG administrative interface. The steps for managing the server have been discussed in
